Hi All, hope you all are well.
In this blog, will look at Juniper’s recent acquisition called Netrounds. Netrounds have been rebranded as Paragon Active Assurance (PAA) which is part of Paragon Automation portfolio and is a programmable, active test and monitoring solution for physical, hybrid, and virtual networks. Unlike passive monitoring approaches, Paragon Active Assurance uses active, synthetic traffic to verify application and service performance at the time of service delivery and throughout the life of the service.
There are various features of PAA however in nutshell, operations teams can use PAA to identify, understand, troubleshoot, and resolve issues before your end users even notice them. This service performance visibility can help decrease incident resolution time by as much as 50%, resulting in greater end-user satisfaction and retention.
We will be using simple topology consisting of a Controller, Test Agents and 2 vMXs to model it in EVE-NG.

Controller has been instantiated by spinning clean Ubuntu 18.04.05 LTS VM and then added the required controller packages.
You can get the Controller up and running by following the below URL:
https://www.juniper.net/documentation/us/en/software/active-assurance3.0.0/paa-install/topics/concept/install-os-software.html
Controller Version: 3.0.0
vMX version: 18.2R2-S4
Test Agent: 3.0.0.23
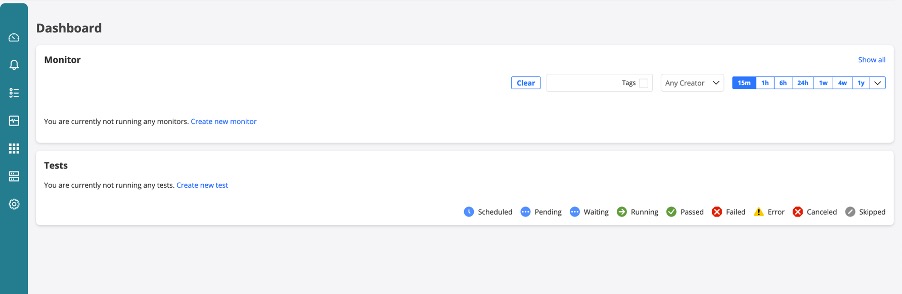
Once the controller is up and running and has been licensed, you can open the UI page on the its management address.
In my case its on https://192.168.8.113/ and you will be presented with login screen where after getting authenticated, you will land on Dashboard page.
For us, as expected nothing is here as no configuration has been added via UI.
Once controllers are up, we will add Test Agents (TA) to manage all from single pane of glass.
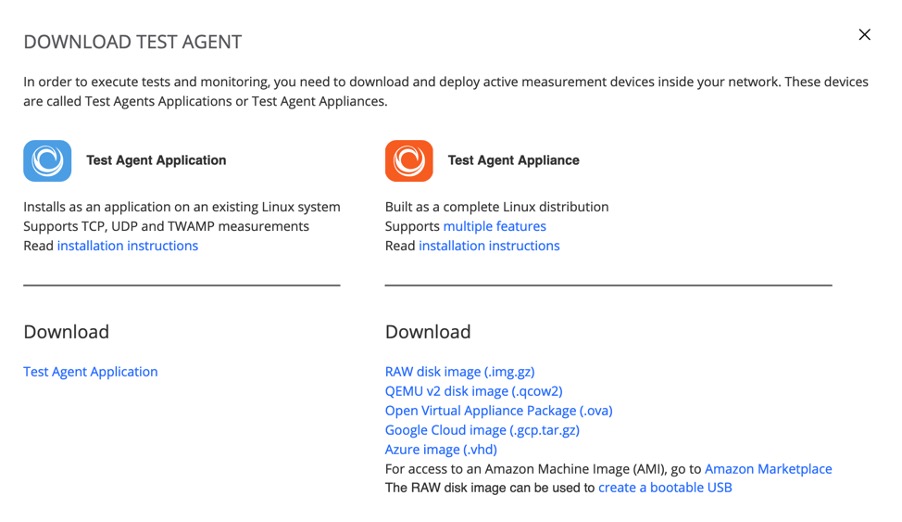
We will add 2 TAs, and for that we need to build new Linux VM however this time its all prepackaged VM in .qcow2 format which we can download from Controller UI.

Download the .qcow2 format, disk image.
Once downloaded, we will boot the VM using this Qemu image and will get the Test Agent up and running. Now we need to open console to TEST Agent and add the Controller IP in format: <controller-ip>:6000
6000 is important as TA and Controller talk on this port. If you have firewall in between, make sure to allow this port.
Once both TAs are added, they will be shown in the Test Agents Section on the left menu of the Controller as below.

Click on each Test Agent and configure the IP Addresses on Revenue port. In my case its eth1 which is connected to vMXs.

Before we delve more into TAs, let me give you run down of vMXs.
vMXs have OSPF, LDP, RSVP, BGP, running between them. I have configured L2VPN CCC between 2 VMXs.
As you can see below, interface towards TA1 is in vlan 601 and hence we need to accordingly add 601 vlan on TA1 and assign the IP. In my case, I have defined 20.20.20.1/24.
root@vMX-1> show mpls lsp
Ingress LSP: 1 sessions
To From State Rt P ActivePath LSPname
2.2.2.2 1.1.1.1 Up 0 * vmx1-to-vmx2
Total 1 displayed, Up 1, Down 0

Egress LSP: 1 sessions
To From State Rt Style Labelin Labelout LSPname
1.1.1.1 2.2.2.2 Up 0 1 FF 299808 - vmx2-to-vmx1
Total 1 displayed, Up 1, Down 0

Transit LSP: 0 sessions
Total 0 displayed, Up 0, Down 0

root@vMX-1> show connections
CCC and TCC connections [Link Monitoring On]
Legend for status (St): Legend for connection types:
UN -- uninitialized if-sw: interface switching
NP -- not present rmt-if: remote interface switching
WE -- wrong encapsulation lsp-sw: LSP switching
DS -- disabled tx-p2mp-sw: transmit P2MP switching
Dn -- down rx-p2mp-sw: receive P2MP switching
-> -- only outbound conn is up Legend for circuit types:
<- -- only inbound conn is up intf -- interface
Up -- operational oif -- outgoing interface
RmtDn -- remote CCC down tlsp -- transmit LSP
Restart -- restarting rlsp -- receive LSP

Connection/Circuit Type St Time last up # Up trans
l2vpn-1 rmt-if Up Mar 5 13:02:14 2
ge-0/0/1.601 intf Up
vmx1-to-vmx2 tlsp Up
vmx2-to-vmx1 rlsp Up
Another important consideration to make is NTP. Make sure NTP is synced properly on TAs before running the test. You can use any NTP server for this or make your controller as NTP server.
That’s all for vMXs, let me know if you have any particular query on it. We will look at TAs now.
To start the test, Click on ‘New Monitor’ under Monitoring option on left hand menu.
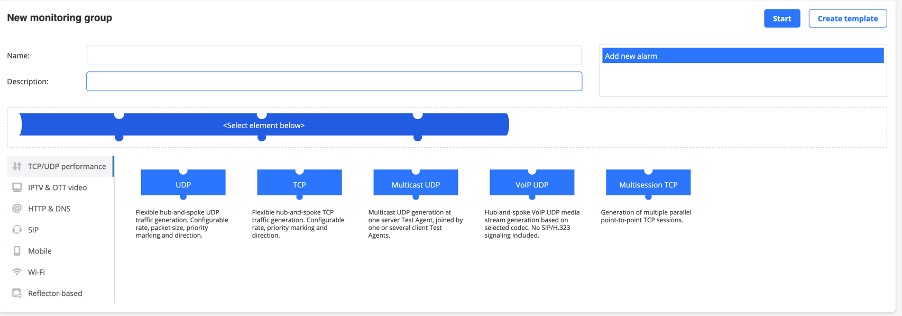
Fill the details and select Element. In our case we have selected 2 Elements, UDP and VOIP UDP which are basically 2 different streams with 2 different profiles going at same time.
Configure each element separately with parameters and Client and Server interface ports.
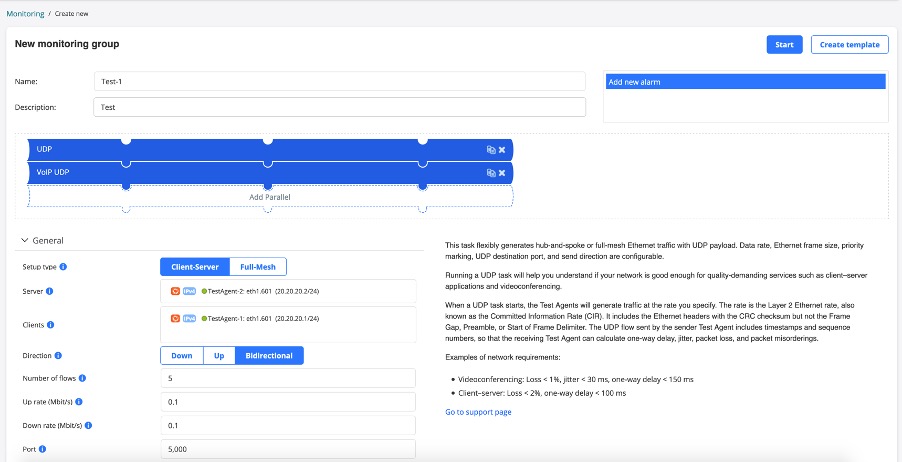
You can define the threshholds here and frame rates, dscp value of streams.


Press the start button. Once started, we can verify the traffic on vMXs in both Input and Output direction below which suggests that bidirectional traffic is working.
root@vMX-1> show interfaces ge-0/0/1 | match rate | refresh 1

---(refreshed at 2021-03-05 13:22:05 UTC)---

  Input rate     : 185792 bps (59 pps)

  Output rate    : 185792 bps (59 pps)

    FEC Corrected Errors Rate               0

    FEC Uncorrected Errors Rate             0

---(refreshed at 2021-03-05 13:22:06 UTC)---

  Input rate     : 185792 bps (59 pps)

  Output rate    : 185792 bps (59 pps)

    FEC Corrected Errors Rate               0

    FEC Uncorrected Errors Rate             0

---(refreshed at 2021-03-05 13:22:07 UTC)---

  Input rate     : 188064 bps (59 pps)

  Output rate    : 188064 bps (59 pps)

    FEC Corrected Errors Rate               0

    FEC Uncorrected Errors Rate             0

---(refreshed at 2021-03-05 13:22:08 UTC)---

  Input rate     : 188064 bps (59 pps)

  Output rate    : 188064 bps (59 pps)

    FEC Corrected Errors Rate               0

    FEC Uncorrected Errors Rate             0

---(refreshed at 2021-03-05 13:22:09 UTC)---

  Input rate     : 187680 bps (59 pps)

  Output rate    : 187680 bps (59 pps)

    FEC Corrected Errors Rate               0

    FEC Uncorrected Errors Rate             0

---(refreshed at 2021-03-05 13:22:10 UTC)---

  Input rate     : 187680 bps (59 pps)

  Output rate    : 187680 bps (59 pps)

    FEC Corrected Errors Rate               0

    FEC Uncorrected Errors Rate             0

---(refreshed at 2021-03-05 13:22:11 UTC)---
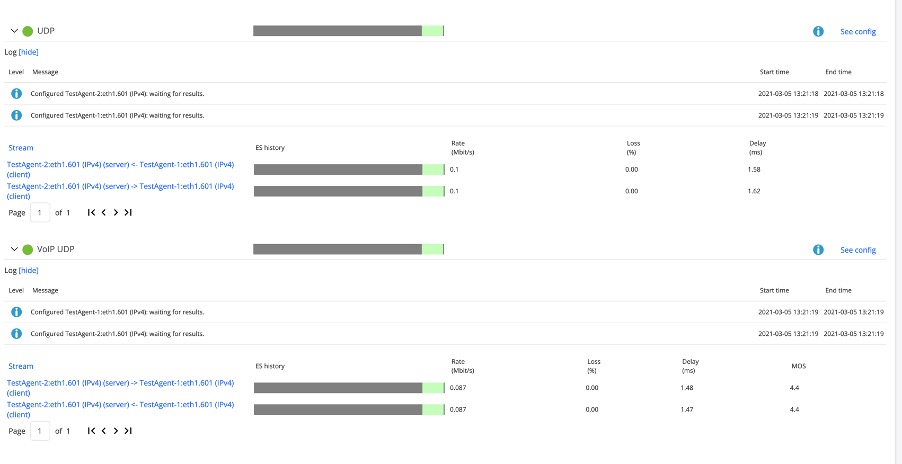
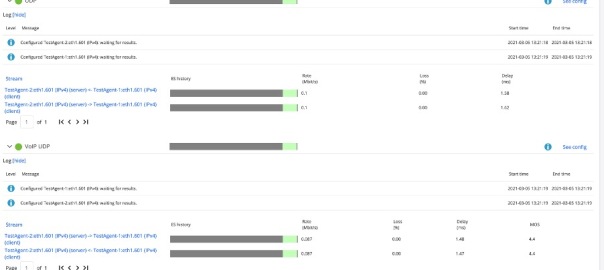
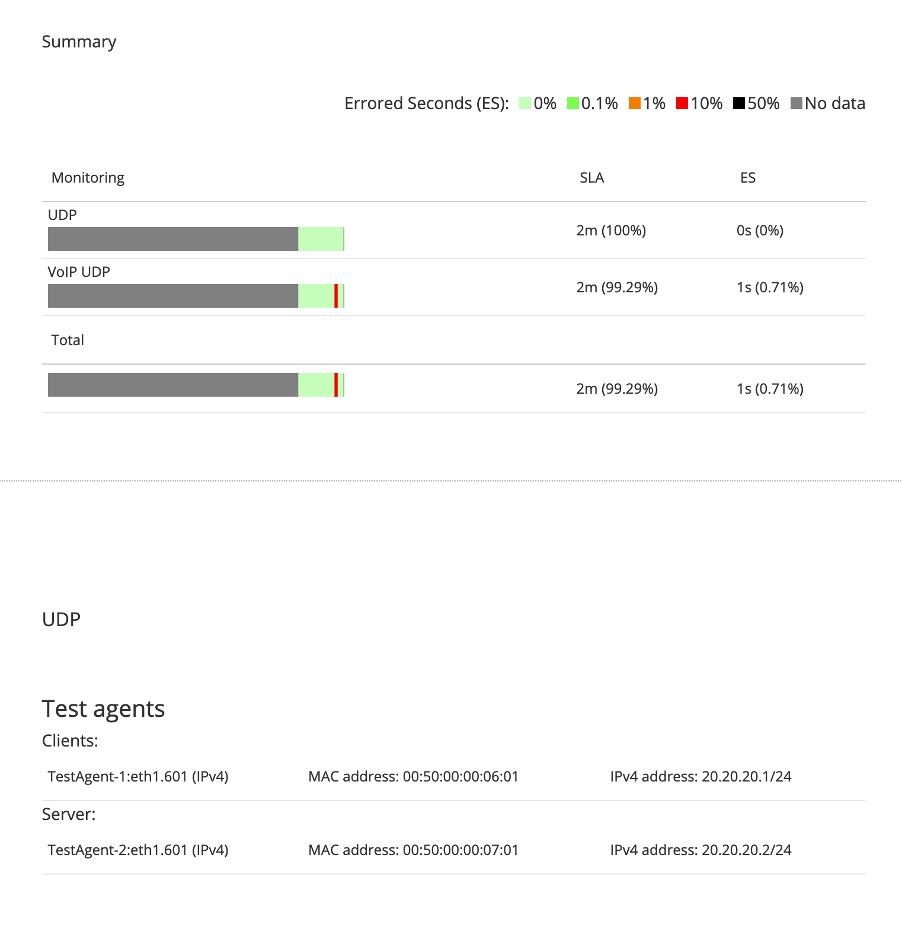
Once stopped. Click on the report at the top and you will get the status of test along with results and graphs.

That’s all from this blog. Its just an introduction to PAA however its capable of doing much much more. We can use the RPM/TWAMP on Routers to get the 2 way or Round trip time measurements from the network which can give you edge before handing over the network to your customers for actual traffic and proactively troubleshoot for any issues.
That’s all for this. I will add more test in next blogs, however till then let me know if you have any queries.
Mohit
